Digging Deeper into Your Donations
How nonprofits can harness actionable insights from donor data
Charitable giving is at an all-time high. According to a report from the Independent Sector last fall, Americans donated $471B in 2020 (a 3.8% increase from 2019). With 75% of millennials and 66% of Gen Z sending some form of financial aid or donating to a nonprofit since the start of the pandemic, a massive opportunity exists for the 1.5M+ charitable organizations in the U.S. to increase donation levels across multiple generations at once.
However, to remain viable in an increasingly crowded market, nonprofit organizations must take a page from the playbook of leaders from other sectors and tap into the power of data-driven customer engagement. And while the positive impacts of analytics have touched nearly every sector in recent years, nonprofits still lag behind. Many organizations, with limited marketing or data science resources, struggle to implement data-driven tactics that can help them effectively engage and connect with their donors.
Fortunately, nonprofit leaders can discover the routes to success and growth using just a few lines of Python, paired with targeted, data-informed marketing efforts. With the help of recent donation data from an education-focused nonprofit, we’ll see how the path towards streamlined, personalized fundraising efforts can emerge through thoughtful analysis of past donation data.
Having studied and performed improv for nearly ten years, I’ve always been a big fan of The Unscripted Project, a Philadelphia-based nonprofit equipping students with the building blocks for personal and professional success through the power of improv. The organization, which launched at the beginning of 2020, has scaled quickly and is now running workshops in twenty schools across the city of Philadelphia. To showcase the potential impact of data analytics for nonprofits, we’ll use an anonymized dataset of 350+ donations made to The Unscripted Project spanning four different fundraising campaigns from the past two years. While this organization — and its fundraising efforts — are still in early stages, the following lessons and concepts can hopefully be applied to nonprofits at various stages of maturity.

WHO are the major donors?
Segmenting donors in your database is a crucial way to create more efficient, targeted fundraising efforts. While the average donation amount from The Unscripted Project dataset is an impressive $177, nonprofits should always make the effort to identify a subset of their most generous donors. For this particular organization, we see the Pareto Principle (a concept where 80% of the effects come from 20% of the causes) in full effect when looking at the donor dataset. Let’s take this one step further. Below we’ve queried the five most generous donors (along with the number of donations they’ve made) over the span of the four different fundraising campaigns. This subset of donors, all of whom have given at least $5,000, are ripe candidates for an extra dose of outreach and fundraising efforts.

Tactical Takeaways
After identifying major donors, nonprofits should properly recognize and thank them for their contributions. This could result in a special event for your major donors or even finding a way to highlight and share the impact their contributions are making to the cause. Conducting proper donor stewardship is a key way to convert major one-time donations into recurring gifts and ensure high retention rates for key donors down the road. Moreover, these efforts can lead nonprofits on a path to better understanding the “why” behind their motivations for donating and how to personalize future marketing efforts toward more donors like them.
WHERE are donations coming from?
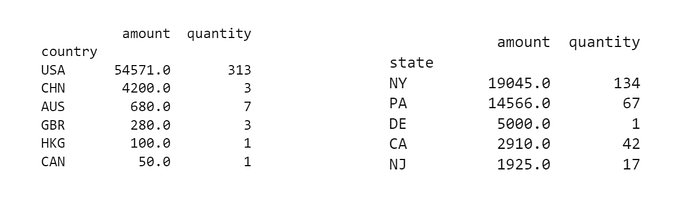
Knowing where donors are based can have strategic ramifications in both the short-term (where should we target our next giving campaign/donor outreach?) and long-term (where should we expand operations?) for nonprofit organizations. Given that The Unscripted Project currently works with schools in Philadelphia, we’d expect to see a large number of donations coming from Pennsylvania and the surrounding states. As the graphs below indicate, this is indeed the case. New York takes the top spot in both the number of donations and the dollar amount most likely because the 2021 Wrap Party Fundraiser occurred in Manhattan.
Tactical Takeaways
Making future campaigns location-based or applying geotargeted advertising can help ensure that people in the areas nonprofits serve are seeing and engaging with their brand. Nearly every major social platform supports geotargeting to help organizations target people in locations best-suited for their impact. Additionally, organizations should take note of when they are receiving significant web traffic (or financial support) from a location outside of the area they serve. This could be a strong leading indicator for both strategic partners to work with and future operational expansion opportunities for a nonprofit.
HOW are donations being made?
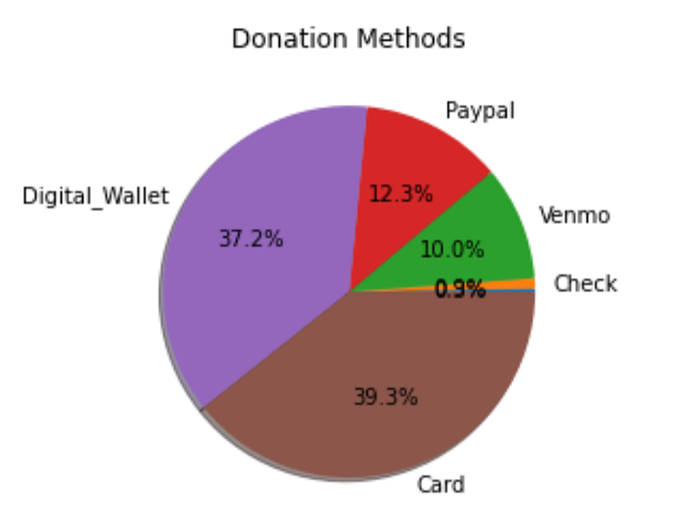
Just as companies try to understand consumer behavior, paying attention to donor-giving habits and preferences can provide fruitful insight for nonprofits. For example, the expansion of payment methods in recent years has enabled donors to give in a variety of ways. By combining the groupby method and Python’s pie chart functionality, we get the below chart showing the preferred payment methods for donors giving to The Unscripted Project. We can see that card and digital wallet (Apple Pay, Google Pay, Microsoft Pay) are the dominant payment methods with a fairly even split between PayPal and Venmo.
Tactical Takeaways
Ensure future campaigns and the organization’s website are optimized for the most frequent, preferred donation methods to make giving as straightforward as possible. Moreover, organizations should consider including both existing (SMS/text) and new (crypto) donation methods to remove any barriers between an organization and donors to improve the success rate or ROI of fundraising efforts. Additionally, building on the previous section of understanding and identifying major or top donors, nonprofits should also ensure they’ve optimized the preferred donation method of choice for their top and recurring donors.
WHEN are donations occurring?
Another way of understanding donor preference and behavior is by looking at the timing of donations. Some of The Unscripted Project campaigns were one-time events, such as Trivia Night; while others were ongoing fundraising efforts, like the Fall Campaign 2020. Below we’ve graphed the donation amounts over the days of the week for all four campaigns by leveraging Python’s dayofweek method during our initial data cleanup and some of the language's helpful charting functionality. By plotting all four campaigns together, we can start to unpack how time may or may not impact donation volumes for particular campaigns.

Tactical Takeaways
Even if the simple analysis doesn’t lead to sweeping, strategy-altering conclusions (if it were only that simple), it still helps to create a baseline of knowledge to inform future campaign planning strategies. As Mark Jeffrey, a professor at Northwestern’s Kellogg School of Management notes in his book Data-Driven Marketing, measuring the results of marketing initiates a feedback loop of adaptive learning to optimize activities. Using the data you have from previous campaigns, develop a hypothesis on the most impactful time to launch a campaign, send an email promotion, or host an event and test it out over time to see what is most effective. Doing so allows you to act on the data at your disposal and reduce “business as usual” decisions that have traditionally guided fundraising efforts.
WHAT campaigns are driving the most donations?
Last, but certainly not least, our focus shifts to the fundraising results of each campaign. The simple table below — built again with the help of a groupby method and some sorting and averaging — displays both the total amount raised and the average donation for each campaign. The impressive results of both online campaigns shows how The Unscripted project has potentially found a repeatable, digital campaign they can run for years to come.
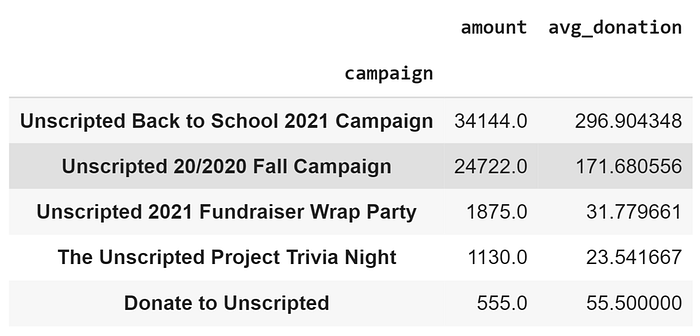
As we’ve seen throughout this exploration, asking — and answering — pointed questions about your donor base can lead to interesting insights; however, it is in the combination of these analyses where true strategic advantages can be uncovered. For example, the graph above certainly underscores the financial benefits of a fall / Back to School themed online fundraising effort; optimizing these campaigns moving forward by running geotargeted promotions during certain days of the week and offering alternative donation types could lead to even greater campaigns moving forward. Moreover, the impact of in-person events is not to be overlooked. Now armed with the insights from their donor analysis, maybe The Unscripted Project could devise a spring campaign inviting the top 20% of their donors to a private, ticketed fundraiser and improv performance featuring students and instructors from the program hosted one weekend night in Philadelphia and another in New York City.
Limitations, Additional Resources & Final Thoughts
- We were dealing with a relatively small database for this analysis (~350 observations)
- While that data at our disposal was helpful, additional information about donors such as age, careers, or donations to other nonprofits could’ve been quite informative
- We only looked at Day of the Week in our “when” section, but, what about month? Could tax season have an implication for fundraising efforts if your nonprofit is a 501(c)(3)?
- Putting hypotheses to work through A/B testing of elements such as donation messaging, landing pages, campaign launch date, and more would be a great follow-up piece!
If you’d like to learn more about nonprofit marketing or customer analytics, I’ve included below a list of helpful articles and posts I came across in the process of researching and writing this post:
- Campaign Monitor — The Data-Backed Guide to Nonprofit Marketing
- Donorbox — Acquiring and Stewarding Major Donors | A Nonprofit’s Guide
- Hubspot — The Ultimate Guide to Nonprofit Marketing in 2022
- Better Fundraising — How You Can Use the 80/20 Rule to Raise More Money
- MonkeyLearn — Customer Analysis: Using Data to Know Your Customers Better
An exciting and hopeful future awaits nonprofits that combine a deep sense of purpose and mission with quantitative mindsets and frameworks that extract insights from data in order to scale their impact. I hope this article serves as a helpful guide for those groups looking for simple ways to drive efficiencies in their fundraising efforts moving forward.
Check out the original code here on Github. What did I forget or what would you have done differently? Any and all feedback is welcome via a comment below, or drop me a note at wmc342@gmail.com. A big thanks to Mick Hammock, Barbara Galiza, and Adrienne Raphel for their edits and insights on this project!
